Among the most effective methods of supply chain optimization is the estimation of transit time and shipping distance. The Distance & Time calculator is a convenient solution and advanced IT tool for shipping design to obtain complete data for any type of transportation around the world.
In this guide, you will learn how to optimize your logistics planning. Let’s figure out how transportation parties can ensure the timely delivery of cargo.
What is transit time?
Transit time is the total delivery time of the container (cargo), calculated from the moment of loading onto the vessel until the moment of unloading at the port of destination.
It is necessary for the freight forwarder, shipper, port authority, and other participants of the logistics process to have the estimated transit time of cargo delivery for accurate planning and preparation of port services, customs procedures, unloading of containers, handling of cargo, etc.
How long does freight shipping take?
Based on very rough calculations of the most popular shipping routes, we can estimate the average transit time. Approximately, the transportation will take:
- LCL (less than container load): 14 - 39 days
- FCL (full container load): 23-42 days
- Air freight: hours to few days
- Land freight: 13-17 days
It is important to estimate transit times for various routes to any location in the world for both consignees and shippers.
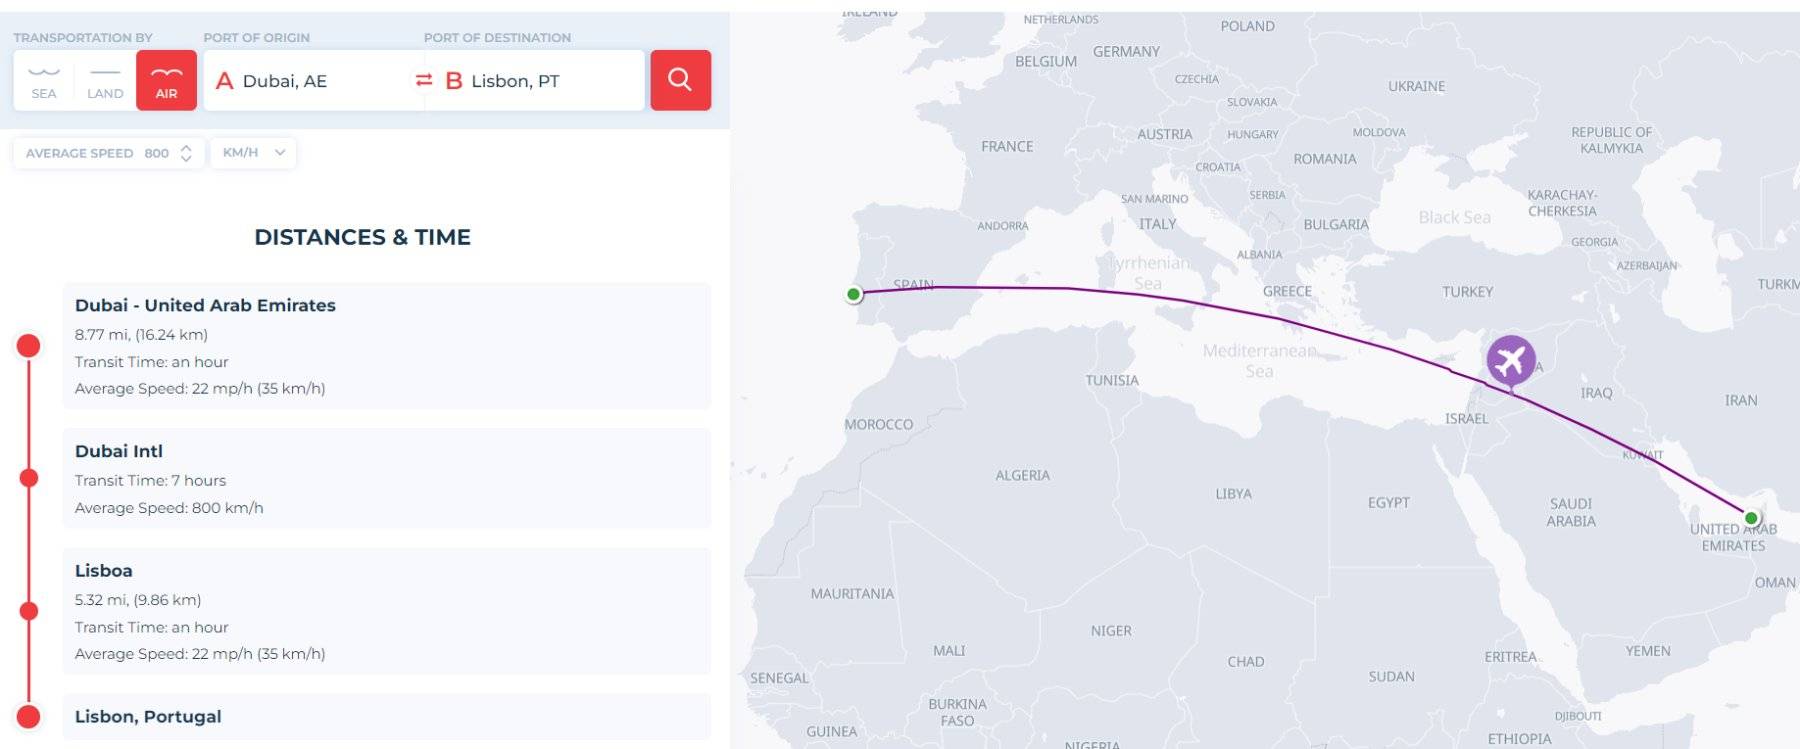
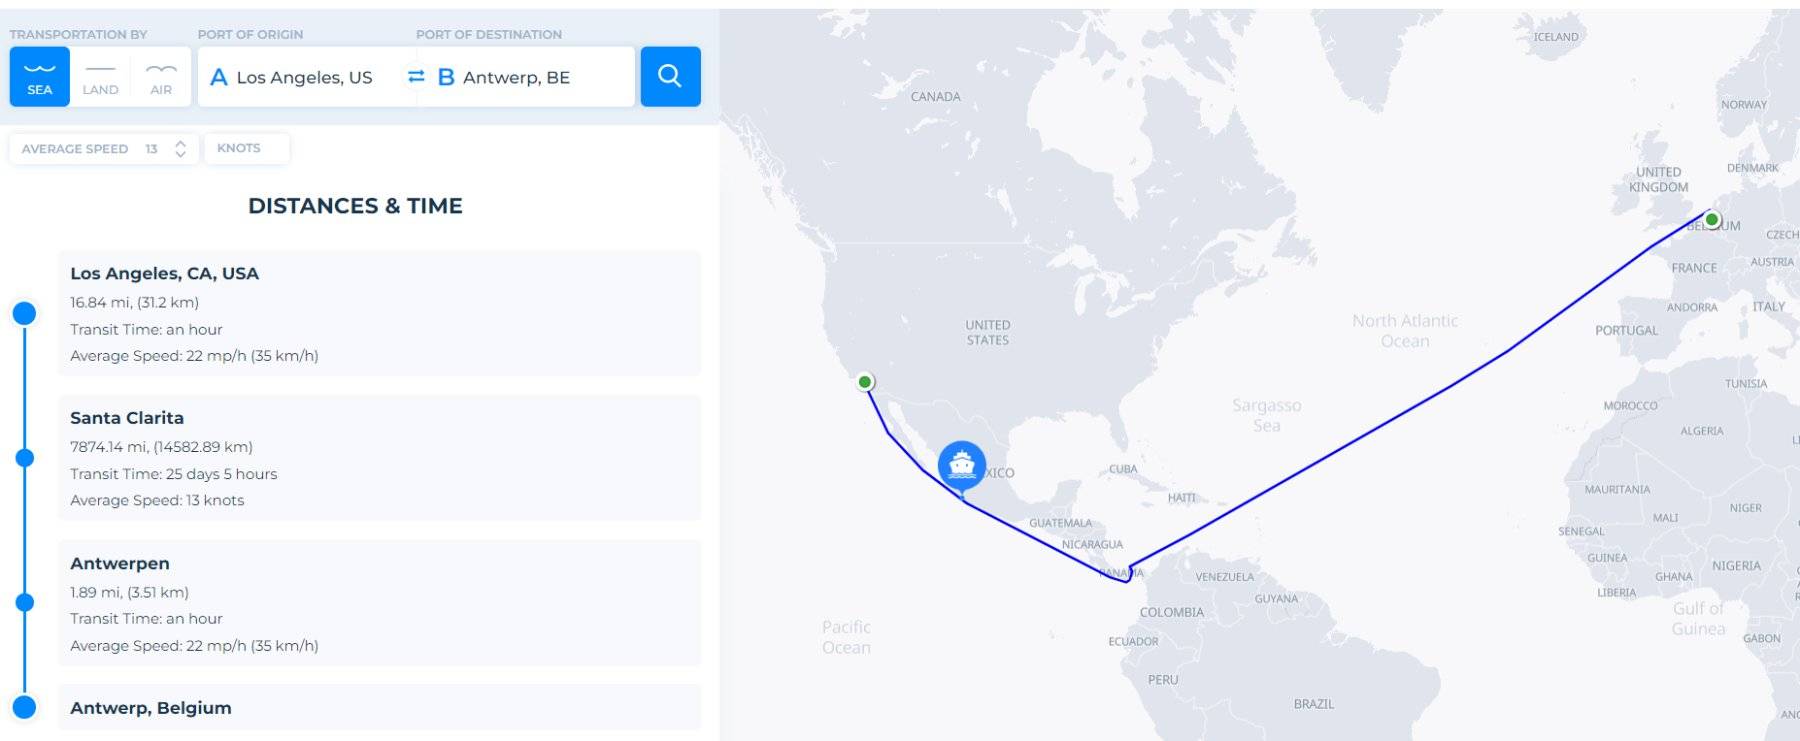
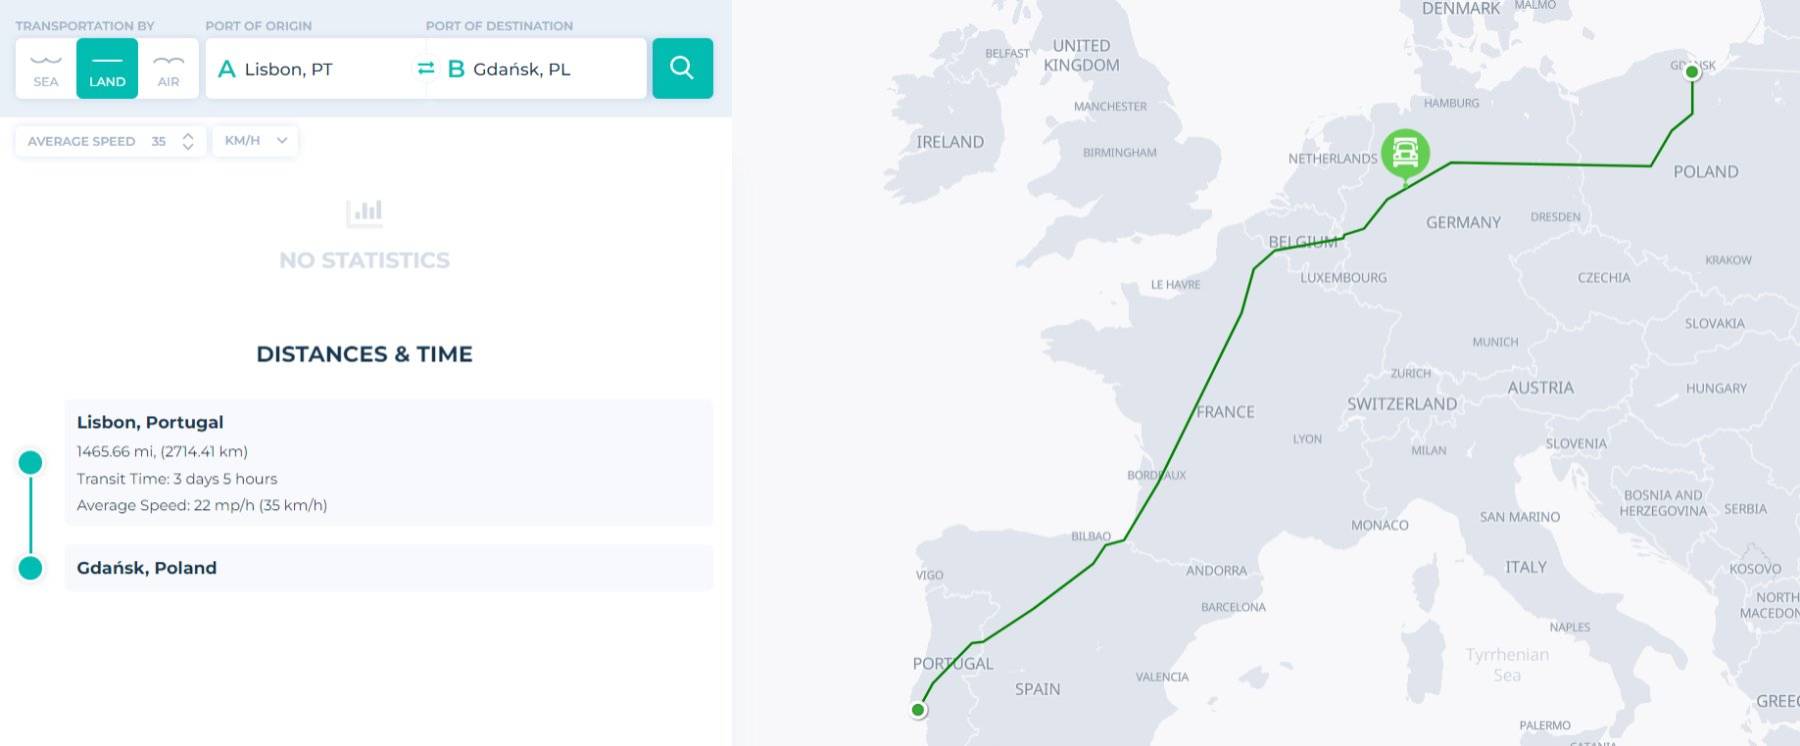
The examples below are case studies of cargo transportation by sea, air, and land for a few popular routes around the world:
| Sea Freight | Los Angeles, US - Antwerp, BE | 25-26 days |
| Air Freight | Dubai, AE - Lisbon, PT | 7-8 hours |
| Land Freight | Rotterdam, NL – Gdańsk, PL | 1-2 days |

We noticed a significant difference in the transit times of three routes at once. The SeaRates team believes it is worth noting the main factors that affect delivery time: route specifics, delivery mode, distance, and time of year.
Other nuances that affect the increase in transit time are given below:
- complex customs procedures can cause delays
- the volume of cargo to be handled at the port
- documentation audits
- unfavorable weather conditions that interfere with the smooth operation of transportation networks
Port to Port Shipping Transit Time
Let's take a look at the differences in delivery methods using the example of sea freight. After all, it is the presence of various delivery methods that causes a large difference in transit time.
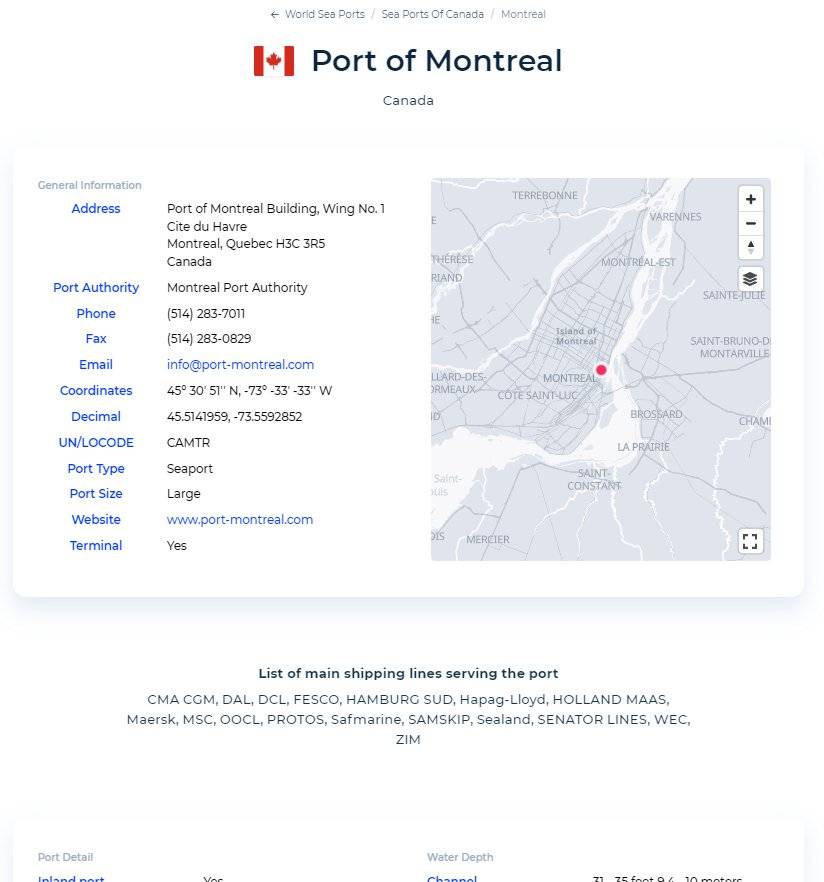
There are about 107,000 UN Codes for Trade and Transport Locations (UN/LOCODE). They are used to identify ports. This makes it easier to identify and find information about any port of destination, origin, or transshipment.
Explore our World Sea Ports app for detailed data on international seaports. You can discover names, postcodes, UN/LOCODE, coordinates, locations, and other port information to plan your supplies.

Here is an example of how transit time varies depending on the route:
If you are shipping a container from Qingdao, China, to Miami, USA, through the Suez Canal, the transit time is expected to be 41 days. At the same time, shipping lines offer a route through the Panama Canal for this transportation, which is more expensive and faster - the transit time is about 35 days.
Distance&Time tool: Benefits
The tool provides you with real-time information about the transportation of many routes displayed on a world map. Detailed shipping data is available to you in a few seconds. Advantages provided by the Distance & Time tool:
- the ability to find and compare the most suitable delivery time for land, air, and sea transportation routes
- receiving data on transit times from various international shipping lines
- the opportunity to choose the best type of shipment based on time and distance data for linear or multimodal routes
- usage of the tool as your own CO2 emission calculator for your routes
- global visibility and planning of the supply chain, helping to avoid demurrage and detention

Once you have the data on the distance and time of your transportation, you can start preparing shipping documents using our Smart Documents app to create templates. This comprehensive approach allows you to quickly compare and choose the best type of transportation for your needs. After that, you will immediately book the best freight rate for your route.
Average Transit Times 2023
The growing demand of world industries and the high availability of quality supplies are driving rapid trade relations, which are gaining momentum year after year. Based on the data from SeaRates.com, let's review the average transit time in 2023 for “Port to Port” and “Door to Door” cargo shipping and compare the results on several popular routes.
Sea and Air freight time from the Netherlands to the US
| Port to port | Door to door | |
| Sea FCL | 14-43 days | 24-53 days |
| Sea LCL | 18-28 days | 28-38 days |
| Air cargo | 8-12 hours | 2-7 days |
Sea and Air freight time from the UK to Canada
| Port to port | Door to door | |
| Sea FCL | 6-18 days | 20-25 days |
| Sea LCL | 9-21 days | 22-29 days |
| Air cargo | 4-7 days | 8-13 days |
Sea and Air freight time from China to Canada
| Port to port | Door to door | |
| Sea FCL | 26-52 days | 31-57 days |
| Sea LCL | 26-52 days | 34-64 days |
| Air cargo | 1-5 days | 4-11 days |
Land freight time from Portugal to Poland
| Port to port | Door to door | |
| FCL | 2-5 days | 12-15 days |
| LCL | 4-7 days | 14-17 days |

Conclusion
When planning for linear or multimodal shipments, you may encounter difficulties managing and gathering information. Therefore, with the SeaRates Distance & Time tool, you can easily calculate the approximate transit time and get a visualization of the route on the world map for any type of transportation.
Before booking a shipment, you need to have detailed information about the upcoming delivery. Together with SeaRates, you will ensure timely cargo transportation to the destination.
Contact us at [email protected] to find out more about SeaRates tools to simplify your logistics operations.

